Tools for Visualization of Data
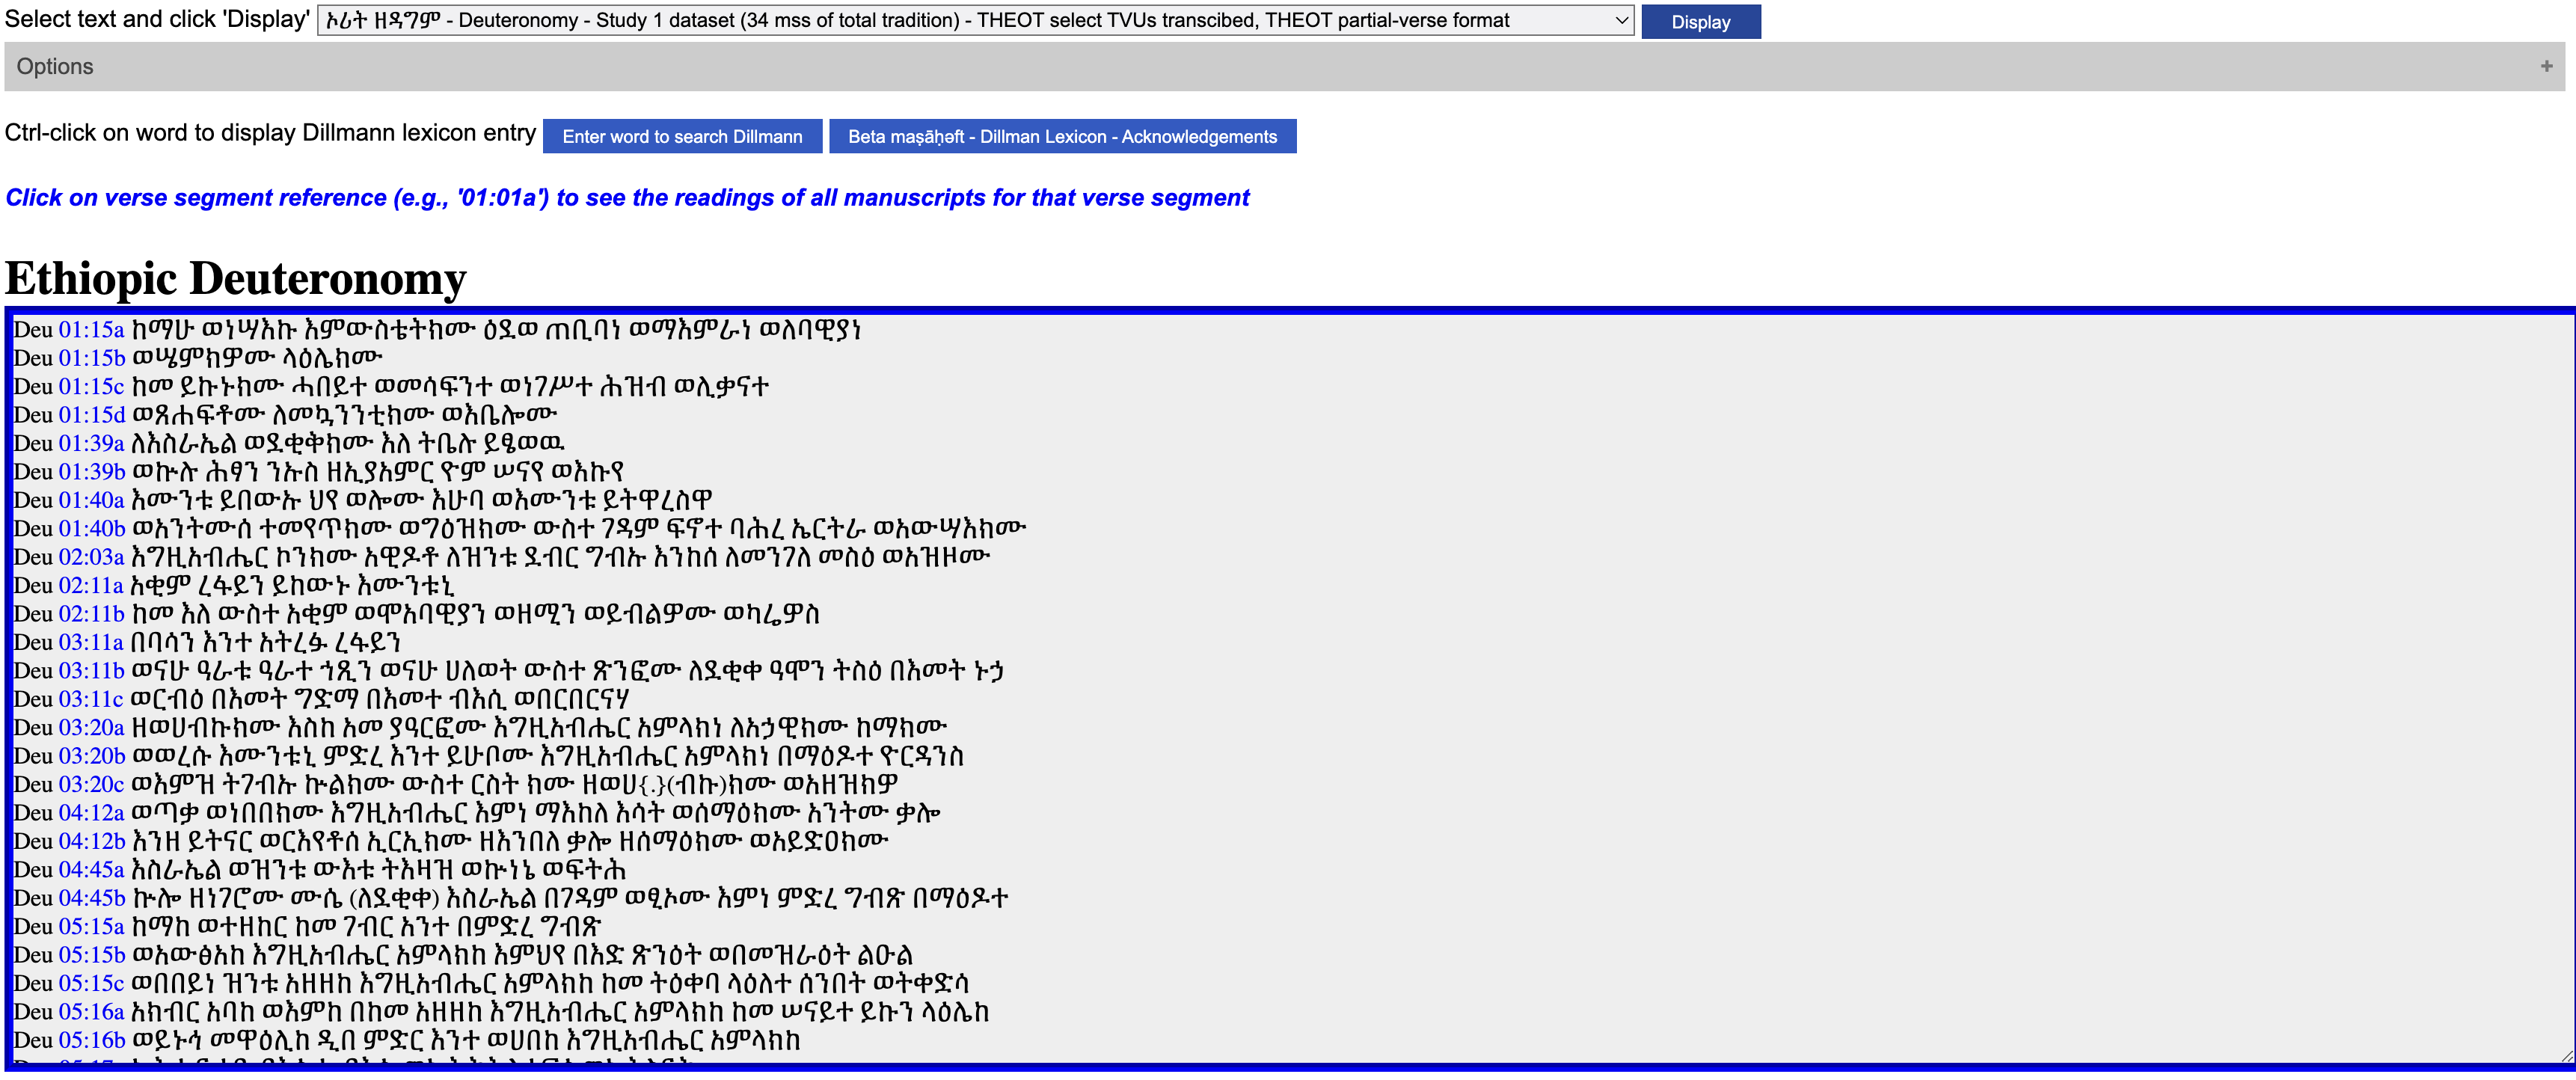
"See the text of an ethiopic Old Testament book in its earliest attested textform."
"Or, see the 30+ witnesses of each book, verse by verse, arranged by cluster."
"There is no better way to see what is going on in the textual history."
"Ultimately, the data exists to be visualized. This is where the stories emerge."
This is a sample table below to be replaced with the real one:
| Visualizations | Videos on Visualizatio |
|---|---|
| Map of Holding Institutions - with Chronological Slider |
|
| Map of Manuscript Locations with Chronological Slider | |
| MS Condition - # missing words | |
| THEOT - Chronological Distribution of Manuscripts - Nov 12 2022 |
|
| THEOT - Scribal Idiosyncrasy - Bar Graphs, Number and Percentage |
|
| THEOT - Scribal Intervention-Judges -Circle Graphs |
|
| THEOT - Scribal Intervention - Judges-Map and Bar Graphs |
|
| Words in Book and Sample | |
| Number of Datapoints | |
| Tables about Manuscripts | |
| Table of Manuscripts by Cluster |
| Videos on Visualization |
|---|
| Holding Institutions of Mss |
| MS Condition - # missing words |
| Mss in Books Chronology |
| Scribal Idiosyncrasy – Unique |
| Readings |
| Words in Book and Sample |
| Number of Datapoints |
| Tables about Manuscripts |
| Table of Manuscripts by Cluster |